
Looking for income and stability? Why investors need to expand their tool kit

While a steady income sounds appealing, having a stable portfolio is just as important with memories of the market's large swings in May still fresh in investors' minds. However, with falling bond yields and the risk of a trade war just a tweet away, investors will likely need to expand their repertoire of asset classes to achieve the twin goal of income and stability.
There are multiple sources of income, so investors need not limit themselves to just one or two. A combined approach can be a more optimal way to help mitigate the various challenges within different income producing asset classes.
Bonds have traditionally been a source of income and stability. As bond yields have fallen lower and even reached negative levels in some countries, investors have gravitated towards higher yielding bonds including high yield bonds and emerging market debt (EMD). These bonds however come with higher volatility compared to investment grade bonds.
The market value of bonds trading at negative yields reached a new record of USD13.7tn1. At the same time, the average yield of the global bond market has fallen from 2.51% in November last year to around 1.64%2. With global central banks poised to loosen monetary policy further to counter the slowing global economy and address weak inflation, rates look likely to remain low for longer.
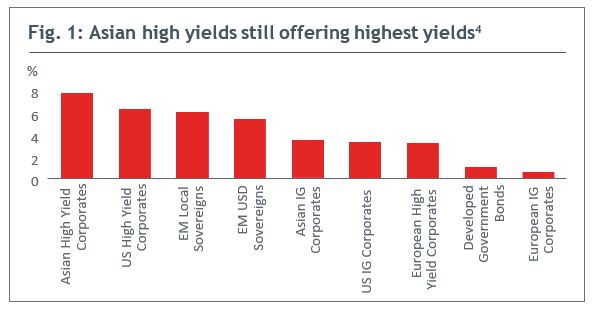
Against this backdrop, it is no surprise that Asian and US high yields have been popular with investors. The Asian high yield bond market has grown six–fold since 2005, providing investors with greater choice. As of end June, the average yield on Asian high yields is around 7.4%, higher than US and European high yields. See Fig. 1.
Credit fundamentals have also been supportive — the average annual default rate for Asian high yield corporates of 2.3% is also significantly lower than other high yield markets3.
Furthermore, the Federal Reserve's rate cut in July gives Asian central banks flexibility to reduce rates, which is potentially supportive of the bond market. That said, given the more challenging growth conditions in Asia and globally, our Singapore fixed income team has turned more selective. While still finding opportunities within Asian high yields, they are also paring exposures in bonds with higher liquidity risks or which may face higher spillover risks arising from the US–China trade conflict.
Over in the US, US high yields' returns in the first half of 2019 (10% in USD terms) have been the strongest since 2016. Two–thirds of the returns came from price gains, a feat that looks unlikely to be repeated in the second half of the year. Nevertheless, the average yield on US high yields is still attractive around 6%, although it is down from 8% at the start of the year. Meanwhile, given above average valuations and slowing US corporate profits, investors need to consider credit quality and liquidity factors more carefully when accessing the US high yield space5.
LOOK BEYOND HIGH YIELDS
In looking for income from bonds, investors may not want to ignore EMD. Afterall, EMD represents a near USD20 trillion universe, or about half of the non–US debt market. With increasingly diverse issuers currently offering average yields of 5–6%6, EMD potentially offers investors another attractive source of income. That said, in–depth bottom–up research would be needed to navigate the vast and diverse universe. Returns from EMD also tend to be more volatile over shorter (1–year) holding periods.
Bonds, however, are not the only assets that offer income. Dividends (from stocks) have also historically been a reliable source of income. In Asia, dividends make up more than 40% of total returns from stocks in the last ten years. This is higher than the share in the US (25%) and Japan (28%). Only Europe is superior, with dividends contributing to 47% of total returns over the same period7.
And there is room for more dividends in Asia with companies currently paying out 36% of their earnings in dividends, below the 47% average of developed markets8. There has also been increasing diversification — Asian dividend payers are no longer restricted to utility or telecom companies. Our Singapore equity income team are currently finding opportunities in the financials, information technology and real estate sectors.
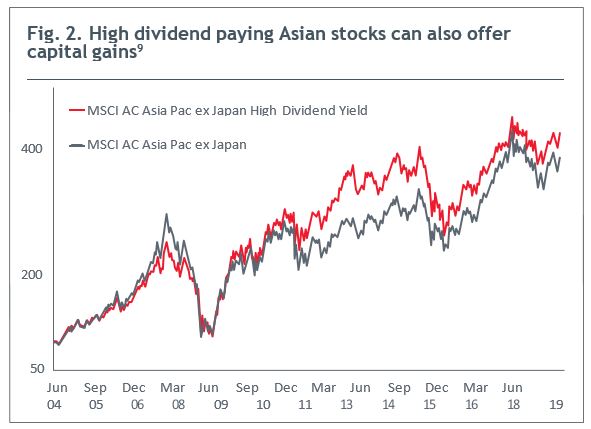
Beyond just income, dividend paying Asian stocks also offer potential capital gains. An index of high dividend yielding Asian stocks have historically outperformed its broader benchmark over the last 10 years. See Fig. 2.
Interestingly, research by MSCI showed that high dividend yielding stocks in the emerging markets outperform their developed market peers as investors regard stable income to be a safe harbour against local economic and currency risks. That said, stock–level research with a focus on cash flow and dividend sustainability would be required to identify true winners.
THE WHOLE IS GREATER THAN THE SUM OF ITS PARTS
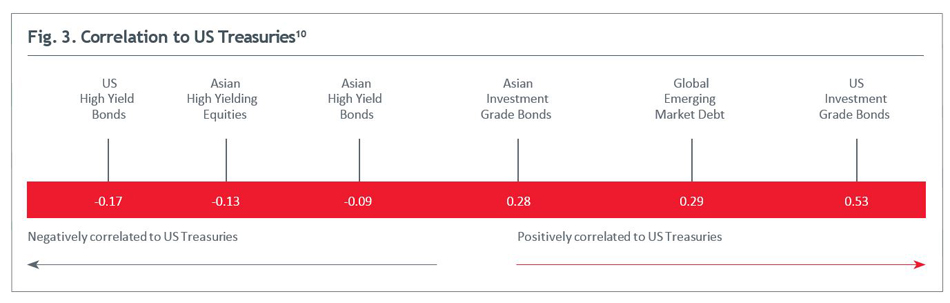
A combined approach provides flexibility to shift exposures between the different income producing asset classes in response to the changing economic and market environment. The various income producing assets have different correlations to US Treasuries (See Fig. 3) and at the same time, US/Asian High Yields appear to fare better in a risk–on environment. As such, lower yielding but less volatile Treasuries and investment grade bonds can play an important role in helping to stabilise a portfolio of income producing assets, especially during periods of high market volatility.
A combined approach can therefore help lower the volatility of an income producing portfolio while increasing the probability of achieving long term capital gains. Capital preservation or gains are important as they enhance and sustain a portfolio's ability to continue paying out regular income over the long term, across all market conditions.
In today's investment climate, where bond yields are falling and markets are likely to fluctuate on the latest trade or economic developments, a diverse portfolio of income producing assets may be better suited to deliver both income and stability to investors. The whole is greater than the sum of its parts.
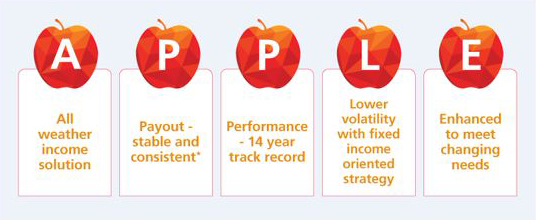
Having delivered 14 years of consistent income, the Eastspring Investments Funds - Monthly Income Plan has recently expanded its toolkit to further defend against market volatility and for the ability to provide income and capture upside during times of economic expansions.
Add a little more zip to your income with an APPLE each month.
*Please visit www.eastspring.com.sg to view the disclosures on the distribution payout. Distributions are not guaranteed. Distributions may be paid out of distributed income, capital or both.
For more information, please visit www.eastspring.com/sg/mip
YOU MAY ALSO LIKE


Disclaimer
The name of the fund “Eastspring Investments Funds – Monthly Income Plan” should not be taken as implying that monthly or regular distributions in respect of units will be made.
This document is solely for information and may not be published, circulated, reproduced or distributed in whole or part to any other person without the prior written consent of Eastspring Investments (Singapore) Limited (“Eastspring Singapore”) (Company Reg No. 199407631H). This document is not an offer, solicitation of an offer, or a recommendation to transact in the investment units in the Fund(s). The information contained herein does not have any regards to the specific investment objectives, financial situation or particular needs of any person. A prospectus in relation to the Fund(s) is available and a copy of the prospectus may be obtained from Eastspring Singapore and its distribution partners. Investors should read the prospectus and seek professional advice before making any investment decision. In the event that investor chooses not to seek advice, he should consider carefully whether the Fund in question is suitable for him. The value of units in the Fund(s) and the income accruing to the units, if any, may fall or rise. Past performance of the Fund(s)/manager is not necessarily indicative of the future performance. Any prediction, projection or forecast on the economy, securities markets or the economic trends of the markets targeted by the Fund(s) is not necessarily indicative of the future performance of the Fund(s). An investment in the Fund(s) is subject to investment risks, including the possible loss of the principal amount invested. Whilst Eastspring Singapore has taken all reasonable care to ensure that the information contained in this document is not untrue or misleading at the time of publication, Eastspring Singapore cannot guarantee its accuracy or completeness. Any opinion or estimate contained in this document is subject to change without notice. The Fund(s)/ underlying Fund(s) may use derivative instruments for efficient portfolio management and hedging purposes.
Distributions are not guaranteed and may fluctuate. Past distributions are not necessarily indicative of future trends, which may be lower. Distribution payouts and its frequency are determined by the Manager, Eastspring Singapore, and can be made out of
(a) income; or (b) net capital gains; or (c) capital of the Fund or a combination of (a) and/or
(b) and/or (c). The payment of distributions should not be confused with the Fund's performance, rate of return or yield. Any payment of distributions by the Fund may result in an immediate decrease in the net asset value per unit.
The preceding paragraph is only applicable if the Fund intends to pay dividends / distributions.
This advertisement has not been reviewed by the Monetary Authority of Singapore. Eastspring Singapore is an ultimately wholly–owned subsidiary of Prudential plc of the United Kingdom. Eastspring Singapore and Prudential plc are not affiliated in any manner with Prudential Financial, Inc., a company whose principal place of business is in the United States of America.
All information here is for GENERAL INFORMATION only and does not take into account the specific investment objectives, financial situation or needs of any specific person or groups of persons. Prospective investors are advised to read a fund prospectus carefully before applying for any shares/units in unit trusts. The value of the units and the income from them may fall as well as rise. Unit trusts are subject to investment risks, including the possible loss of the principal amount invested. Investors investing in funds denominated in non-local currencies should be aware of the risk of exchange rate fluctuations that may cause a loss of principal. Past performance is not indicative of future performance. dollarDEX is affiliated with Aviva but dollarDEX does not receive any preferential rates for Aviva products as a result of this relationship. Unit trusts are not bank deposits nor are they guaranteed or insured by dollarDEX. Some unit trusts may not be offered to citizens of certain countries such as United States. Information obtained from third party sources have not been verified and we do not represent or warrant its accuracy, correctness or completeness. We bear no responsibility or liability for any error, omission or inaccuracy or for any loss or damage suffered by you or a third party (including indirect, consequential or incidental damages) arising in any way from relying on this information.
This information does not constitute an offer or solicitation of an offer to buy or sell any shares/units.
This article has not been reviewed by the Monetary Authority of Singapore.
Information is correct as of 20/09/2019.
-
1Bloomberg. As of 26 July 2019.
2Bloomberg. 13 August 2019.
3Source: JP Morgan, 20 February 2019; excluding 100% quasi–sovereigns.
4Bloomberg. Eastspring Investments. BofAML, Citigroup, Markit iBoxx as at 28 June 2019. Asian HY Corps as represented by BofA Merrill Lynch Asian Dollar High Yield Corp Index. Asian IG Corp as represented by BofA Merrill Lynch Asian Dollar Investment Grade Corp Index. US IG Corp and US HY Corp as represented by BofA Merrill Lynch US Corp and High Yield Indices respectively, Asian Local Bonds as represented by the Markit iBoxx Asian Local Bond Index, Asian USD Bonds as represented by BofA Merrill Lynch Asian Dollar Index, Developed Govt bonds represented by Citigroup World Government Bond index. EUR HY Corp and EUR IG Corp represented by BofA Merrill Lynch Euro High Yield and Euro Corporate Indices respectively. EM USD Sovereign as represented by JP Morgan EMBI Global Diversified External Debt Index. HY= High Yield, IG = Investment Grade. Average yield for corporate bonds are based on yield to worst.
5PPM Quarterly Insights. 2Q 2019.
6End June 2019.
7Bloomberg. In local currency terms for Europe and Japan. June 2009 to June 2019.
8Bloomberg. 2018 figures.
9MSCI. End June 2019.
10Bloomberg, Eastspring Investments, 28 June 2019, based on monthly returns;
*The above is not drawn to scale; US Treasuries as measured by ICE BofAML US Treasury Index, Asian High Yield and Asian Investment Grade Bonds as measured by JPM JACI Corp non investment grade and JPM JACI Index respectively. Asian High Dividend Yielding Equities as measured by MSCI AC Asia High Dividend Yield Index. Global Emerging Market Debt as measured by JPM EMBI Global Diversified Index. US Investment Grade Bonds as measured by the ICE BofaML US Corporate Index. Please note that there are limitations to the use of such indices as proxies for the past performance in the respective asset classes/sector.