
What you must know about intermarket relationships and its opportunities
Like many DIY investors out there, you may have been investing for some time and spent a great deal of time closely monitoring the markets. But do you know how the different sectors of the market interact with each other and how it can help in smarter portfolio allocation strategies? What potential opportunities can you look out for?
Just like the changing seasons from Spring to Summer, Fall to Winter, the financial and business world also revolves in cycles. Here is a summary of what you need to know about different stages of the business cycle and the intermarket relationships between bonds, stocks and commodities.
The diagram below from Stockcharts.com shows an idealised business cycle and the intermarket relationships during a normal inflationary environment, based upon the Intermarket Review by Martin J. Pring (www.pring.com). The business cycle shows a sine wave where the first three stages are part of an economic contraction (weakening, bottoming, and strengthening). Stage 3 shows the economy in a contraction phase, but strengthening after a bottom. As the sine wave crosses the midpoint, the economy transits from contraction to the three phases of economic expansion (strengthening, topping, and weakening). Stage 6 shows the economy in an expansion phase, but weakening after a top.
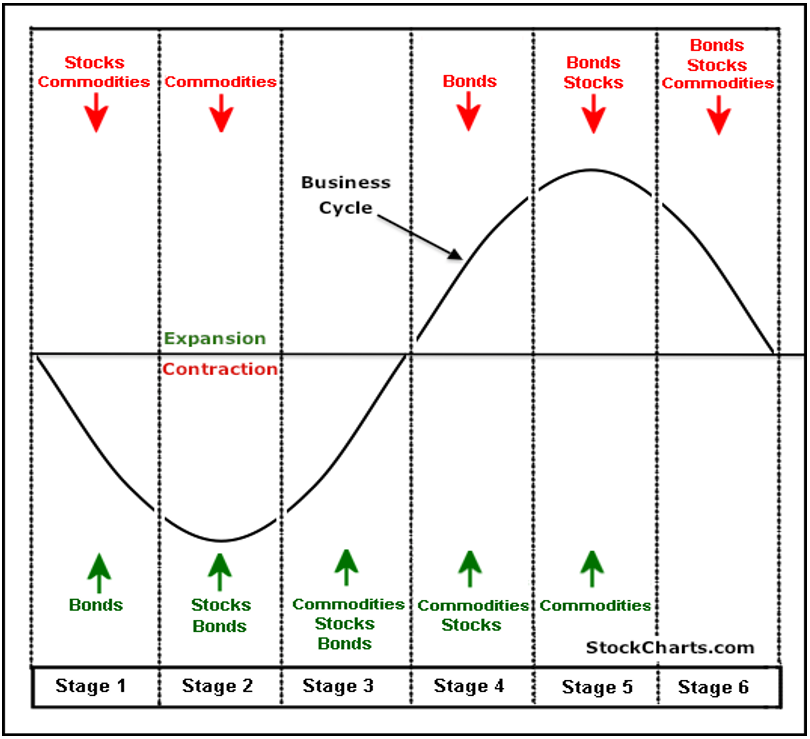
Source: http://stockcharts.com/school/doku.php?id=chart_school:market_analysis:sector_rotation_analysis
Stage 1: The economy contracts and bond prices increase as interest rates decline. Economic weakness favours loose monetary policy and lowering of interest rates by central banks, which is a bullish case for bonds.
Stage 2: The economy and the stock market bottoms out and stabilizes. Even though economic conditions have stopped deteriorating, the economy is still not at an expansion stage or actually growing. However, markets are forward-looking and stocks anticipate an expansion phase by bottoming before the contraction period ends.
Stage 3: A vast improvement in economic conditions as the business cycle prepares to move into an expansion phase. Stocks have been rallying and commodities now anticipate an expansion phase by turning up.
Stage 4: The recovery is in full swing. Both stocks and commodities are rising and making new highs, but bond prices take a turn as the expansion increases inflationary pressures. Central banks start hiking interest rates to combat inflationary pressures.
Stage 5: Economic growth and the stock market approaches the peak. Even though the expansion continues, the economy grows at a slower pace as rising interest rates and rising commodity prices take their toll. Stocks anticipate a contraction phase by peaking before the expansion actually ends. Commodities remain strong and peak after stocks.
Stage 6: The economy deteriorates as the business cycle prepares to move from an expansion phase to a contraction phase. Stocks decline and commodities now turn lower in anticipation of decreased demand from the weakening economy.
If the above from Stockcharts.com holds true and that the business and financial markets do experience a cycle that repeats itself over and over again, which stage do you think we are at now?
How should you position your investment portfolio in anticipation of this?
Would you fall into the trap of taking profit too early and miss the biggest rally of this decade?
Just as hindsight is always 20/20, no one can be a hundred percent sure when to call an end to the bull market or the end of a downturn.
Here are some examples of funds on our platform that are categorized by the respective sectors to look at how they have performed over the past 6 to 12 months between June 2017 to June 2018; which may provide some insights as to which stage we are at in the current business cycle. Search these funds easily with our Fund Finder.
Global equities continue to log healthy gains
Lion Global Infinity US500 Stock Index Fund SGD +3.36% in the last 6 months and +10.58% in the last 12 months
First State Dividend Advantage +5.65% in the last 6 months and +14.24% in the last 12 months
Bond prices have softened
PIMCO GIS Income E (SGD Hedged) Inc SGD Acc -2.23% in the last 6 months and -0.77% in the last 12 months
Franklin Templeton GTR Fund A Mdis SGD H1 -4.88% in the last 6 months and -5.89% in the last 12 months
Commodity funds have risen sharply since 2017
JPM Global Natural Resources Fund A Acc up +10% in the last 6 months and +22% in the last 12 months
UOBAM United Global Resources Fund +13% in the in the last 6 months and +27% in the last 12 months
If the recent performance of these few sector funds coupled with the macroeconomic news of rate hike and rising interest rates, we may well be at Stage 4 of this current business cycle.
That said, we are not implying that you should start selling all of your bonds and equities or going all-in into commodities. There is no clear-cut signal to sell stocks; in fact, there can still be excellent profits from the bull market during this time. Hence it is definitely wise to stay invested and diversified. You can do that through a regular savings plan (RSP) to ride out price fluctuations or invest into a model portfolio which can also help you achieve diversification into different asset classes.
http://stockcharts.com/school/doku.php?id=chart_school:market_analysis:sector_rotation_analysis
All information here is for GENERAL INFORMATION only and does not take into account the specific investment objectives, financial situation or needs of any specific person or groups of persons. Prospective investors are advised to read a fund prospectus carefully before applying for any shares/units in unit trusts. The value of the units and the income from them may fall as well as rise. Unit trusts are subject to investment risks, including the possible loss of the principal amount invested. Investors investing in funds denominated in non-local currencies should be aware of the risk of exchange rate fluctuations that may cause a loss of principal. Past performance is not indicative of future performance. dollarDEX is affiliated with Aviva but dollarDEX does not receive any preferential rates for Aviva products as a result of this relationship. Unit trusts are not bank deposits nor are they guaranteed or insured by dollarDEX. Some unit trusts may not be offered to citizens of certain countries such as United States. Information obtained from third party sources have not been verified and we do not represent or warrant its accuracy, correctness or completeness. We bear no responsibility or liability for any error, omission or inaccuracy or for any loss or damage suffered by you or a third party (including indirect, consequential or incidental damages) arising in any way from relying on this information.
This information does not constitute an offer or solicitation of an offer to buy or sell any shares/units.
Information is correct as of 10/07/2018.